The US Housing Market Is Frozen Solid. The People Paying for It Are the Ones Who Cannot Wait
A 30 year mortgage went from under 3% to 7.4% in 4 years, and the whole system seized up. I went through the Freddie Mac, NAR, Redfin, and FHFA numbers to show exactly how buyers and owners got locked in from both ends, and why the people who can least afford to wait are the ones paying for it.
Last verified Also on Medium
On this page
The US housing market has mostly stopped working, and it did not take a crash to get there. It took a rate move. In 2021 you could lock a 30 year fixed mortgage under 3%. As of mid October 2026, the Freddie Mac average sits at 7.4%, more than double. That single change rewired the incentives for everyone holding a house and everyone trying to buy one, and the result is a market where almost nobody wants to move. I want to walk through the mechanics, with the actual numbers, because the frozen version of a housing crisis hurts a very specific group of people, and it is not the ones you would guess.
The rate sets the payment, and the payment is the real price
Almost nobody buys a house outright. They buy a monthly payment, and the mortgage rate sets that payment. That is the whole reason rates matter so much more than the sticker price.
Run the math on a typical American home, around $420,000. Put 20% down and you are financing about $336,000 over 30 years. At the 2021 low of roughly 2.65%, the principal and interest came to about $1,350 a month. At today’s 7.4%, that same loan on that same house runs about $2,330 a month. Nothing about the house changed. The buyer is simply paying close to $1,000 more every month, nearly $12,000 a year, for the identical 4 walls. Current Freddie Mac data puts the 30 year at 7.4%, up from 6.27% a year earlier.
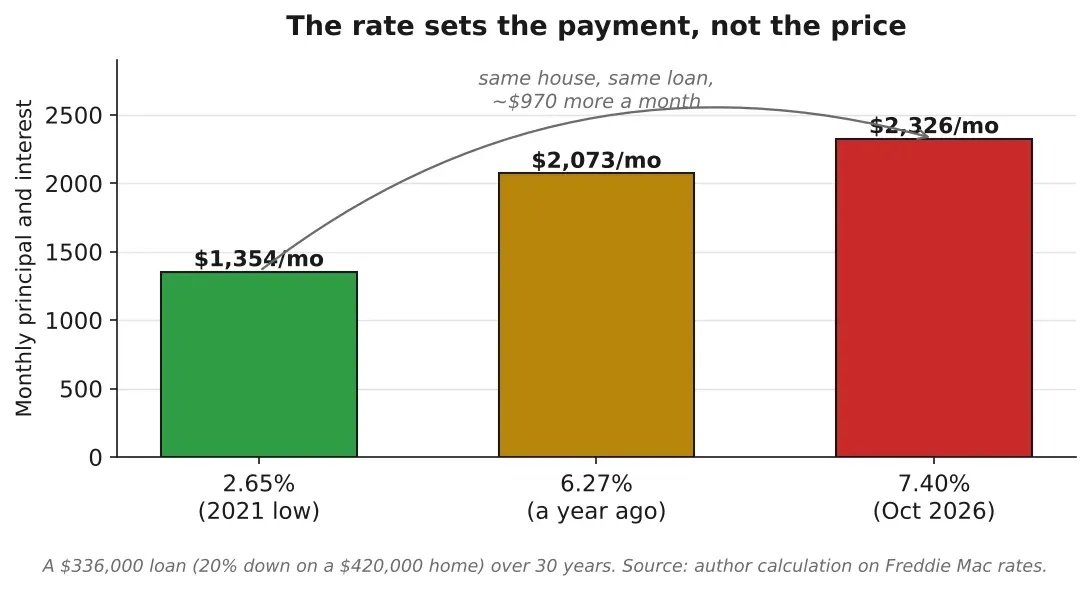
Figure 1. The same $336,000 loan on the same house, priced by the rate alone. The monthly payment nearly doubled between 2021 and 2026 without the house changing at all. Source: Author calculation on Freddie Mac 30 year rates
Scale that up and it stops being 1 couple’s problem. The National Association of Realtors estimates that every 1% drop in mortgage rates lets roughly 5.5 million more households qualify to buy, including about 1.6 million renters. Run that in reverse and a rate climb does not price out a handful of buyers, it removes millions of them from the pool at once, and none of them get a vote.
The lock-in effect, or why owners will not sell
Here is the other jaw of the vise. If buyers are getting squeezed out, you would expect owners to drop prices to reach the ones still standing. Most of them will not, because selling means giving up their mortgage.
Picture a homeowner who refinanced in 2021 at 3%. Their payment has not moved in years. The family grows, and in a normal market they would list, sell, and trade up. Selling now means paying off that 3% loan and signing a new one at 7.4% on a more expensive house. So they stay. This is the lock-in effect, and the cheap old mortgage has quietly become more valuable than the freedom to move.
This is not a niche situation. Based on Federal Housing Finance Agency data through late 2024, about 55% of mortgaged US homeowners hold a rate below 4%, and roughly 21% are below 3%. More than half the country’s mortgage holders are sitting on money they would have to set on fire to move. Redfin’s data shows the median homeowner now stays put for 12 years, up from 6.5 years in 2005. People are staying in their homes nearly twice as long as they did 2 decades ago.
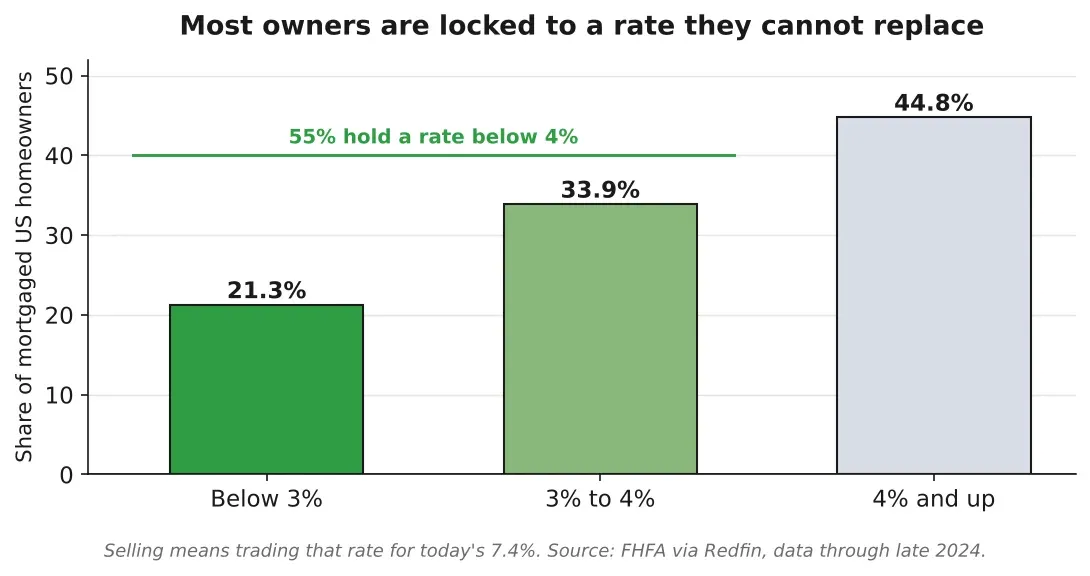
Figure 2. More than half of US mortgage holders carry a rate below 4%, and about 21% are under 3%. Moving means trading that for 7.4%, so they stay. Source: FHFA National Mortgage Database via Redfin, data through late 2024
What a frozen market looks like on the ground
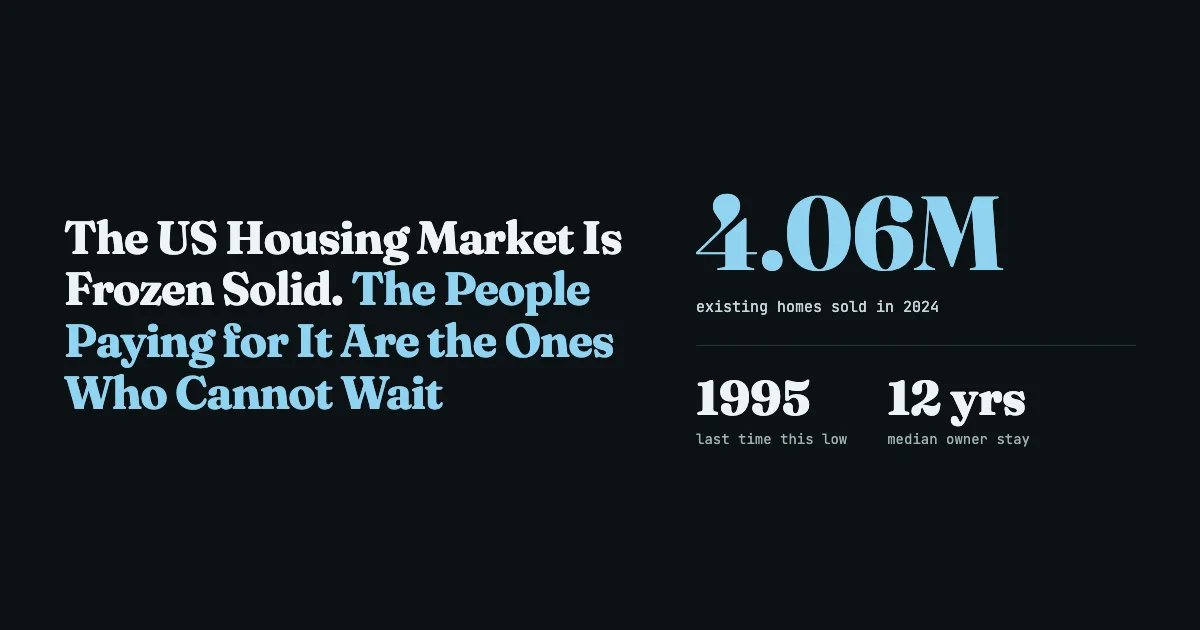
When buyers cannot come in and owners will not come out, transactions collapse. In 2024, Americans bought about 4.06 million existing homes, the fewest since 1995. That is a 30 year low in a country with roughly 70 million more people than it had in 1995.
The listings that do appear tend to sit. By late summer 2026 the typical home was spending close to 2 months on the market, and a growing share of sellers were cutting their asking price. The 2 sides are anchored to numbers that no longer meet. The seller is anchored to what the neighbor got last year. The buyer is anchored to what the monthly payment allows this year. Redfin has reported the widest gap between sellers and buyers since it began tracking in 2013, with sellers outnumbering buyers by around half a million, the most on record, which is the kind of imbalance that eventually drags prices down. Even when a deal comes together, it often dies before closing, as cancellation rates have climbed to records in recent reports.
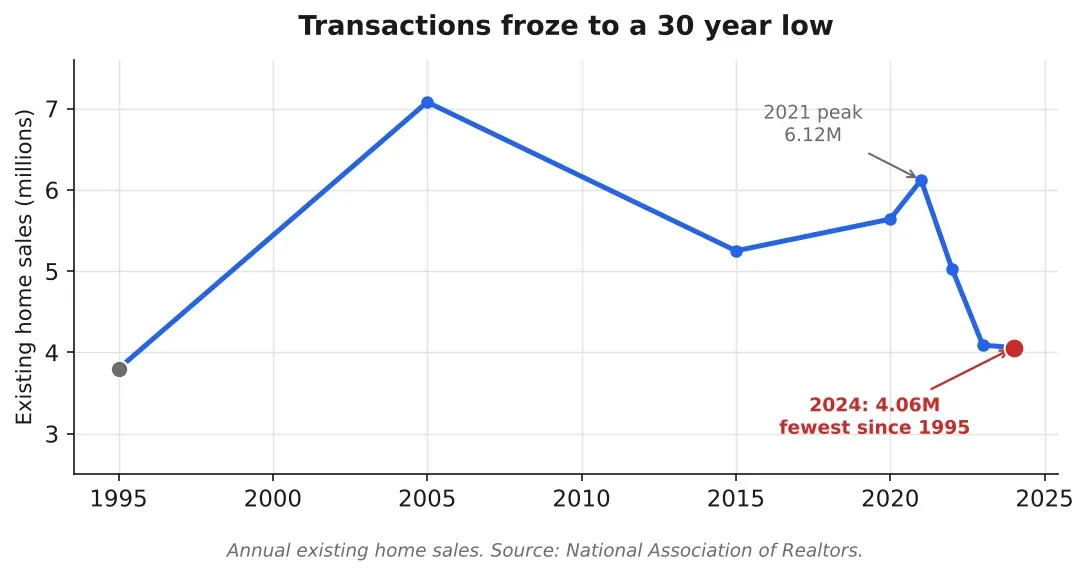
Figure 3. Existing home sales fell to about 4.06 million in 2024, the fewest since 1995, even as the US population kept growing. Source: National Association of Realtors, via Fortune 2025
The one group that cannot afford to wait
Individual sellers can hold out. Builders cannot. A builder does not live in its houses, and every finished home sitting empty is capital tied up and carrying costs piling on, so builders do the thing individual owners refuse to do. They cut.
In September 2026, the National Association of Home Builders found that 38% of builders had cut prices, with the average reduction holding at 6%, and 66% were offering incentives like mortgage rate buydowns, where the builder pays to drop the buyer’s rate, plus help with closing costs. Builder confidence sat at 32 on the NAHB index, matching the lowest level in over 3 years. You can see the effect in the pricing. For 4 straight quarters, the median existing home has sold for more than the median new home, a reversal of the usual order, because builders are discounting hard while resale sellers hold the line. Next to every resale listing clinging to last year’s price, there is now a brand new house that is cheaper, with a cheaper mortgage attached, and it sets the floor the neighbor has to compete against.
The first rung is the one that broke
The person who keeps the whole ladder moving is the first time buyer, and that rung is in the worst shape of all. According to NAR’s 2025 Profile of Home Buyers and Sellers, the median first time buyer in America is now 40 years old, a record. First time buyers make up just 21% of all buyers, also a record low, and NAR notes that share has contracted by about half since 2007. The ones who do get in are putting down a median 10%, the highest since 1989, and the typical repeat buyer is now 62.
Sit with that age profile. A milestone that used to arrive in your late 20s or early 30s now lands at 40, if it lands at all. You rent through your 20s and save, the savings grow through your early 30s, and the target keeps moving faster than the account can chase it, because higher rates raise the payment every year you wait. By the time the keys land, half a working lifetime has gone by.
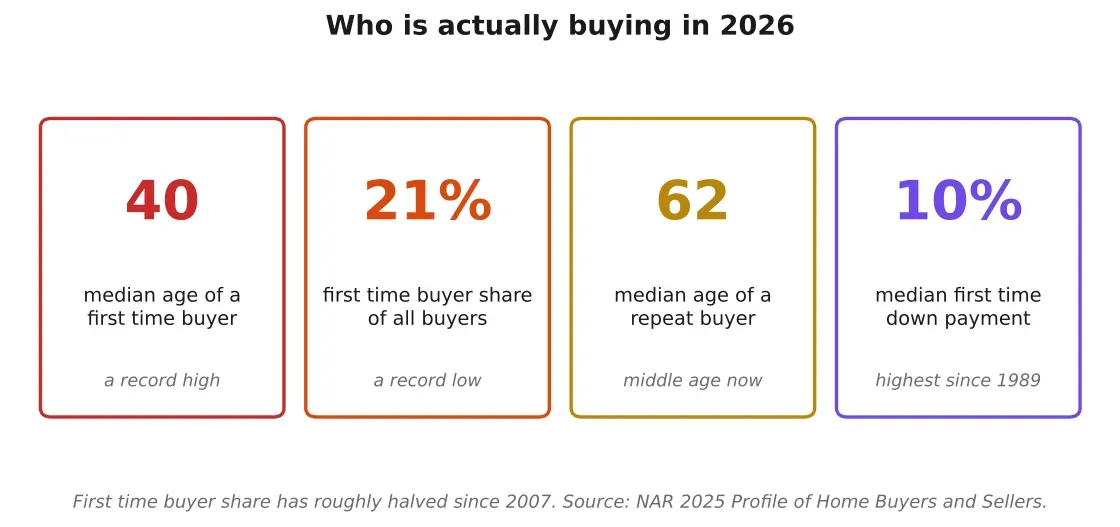
Figure 4. The first time buyer is now 40 years old and makes up just 21% of buyers, a record low, with the repeat buyer at 62. The bottom rung of the ladder is the one that gave way. Source: NAR 2025 Profile of Home Buyers and Sellers
A frozen market is not a stable one
A common read on all of this is that the market is simply on pause and will thaw when rates fall. I think that read misses who is absorbing the damage right now.
A house is worth what someone actually pays for it, and when very few houses sell, prices get set by a small number of deals. Pending sales in late 2026 ran near their lowest since 2014 outside the 2020 lockdown, so each individual sale carries far more weight than it should, and nobody can read where the market truly is. The owner with the 3% mortgage can sit tight. The renter can keep renting. The people who get hurt are the ones who cannot wait, the worker relocating for a job, the family that outgrew the house, the owner forced to sell into one of the thinnest buyer pools in years, to buyers who know the seller is under pressure. They take the full hit. The buyers who do commit are not comfortable either, since the typical payment on an existing home now eats roughly 36% of the median income, so the people signing are often the ones stretched the furthest.
The old property ladder was simple. You rented, bought a starter home, traded up, and someone younger took your old place. Every rung of that is jammed now. If you are buying, the monthly payment is the real price. If you are selling, your competition is the builder down the road with a rate buydown. If you are holding, the cheap mortgage is a genuine asset and also the reason you are stuck. The market is waiting to see who runs out of time first, and the answer, so far, is whoever had the least room to wait.
Sources
- Freddie Mac Primary Mortgage Market Survey, 30 year rate at 7.40%, October 2026globenewswire.com. Accessed 20 October 2026.
- National Association of Realtors, a 1% rate drop and buyer demandnar.realtor. Accessed 20 October 2026.
- Redfin, the mortgage rate lock-in effect and FHFA rate distributionredfin.com. Accessed 20 October 2026.
- Redfin, median US homeowner tenureredfin.com. Accessed 20 October 2026.
- Fortune, US home sales in 2024 lowest since 1995fortune.com. Accessed 20 October 2026.
- NAHB, September 2026 Housing Market Index, builder price cuts and incentivesmortgagenewsdaily.com. Accessed 20 October 2026.
- NAHB Eye on Housing, new versus existing home priceseyeonhousing.org. Accessed 20 October 2026.
- NAR, first time buyer share at record low, median age 40, 2025 Profilenar.realtor. Accessed 20 October 2026.
Related stories

Crypto & markets
4 of the World’s Biggest Markets Are Being Propped Up With Your Money
Japan, South Korea, the United States, and China have each turned an emergency intervention into a standing feature of the market. 2 of the 4 run on pension savings. Here is how each one works, and what happens when the backstop gets tested.
Crypto & markets
If the Democrats Win the Midterms, Here Is What Actually Changes, and What Does Not
The question gets asked every cycle, and the answer usually arrives wrapped in either panic or celebration. The real mechanics are narrower and more interesting than either. I went through what a House majority can actually do, what adding the Senate changes, and where the hard constitutional walls sit that no election moves, using the 2016 to 2021 record as the clearest recent example. This is a civics explainer, not a prediction and not advice on who to vote for.

Crypto & markets
Richard Heart Beat the SEC on a Technicality, Then His Own Tax Office Caught Up With Him in…
On 14 October 2026, Turkish police arrested the founder of Hex and PulseChain on an Interpol red notice issued for Finland, which suspects him of gross tax evasion. He had walked away from a $1 billion SEC case 18 months earlier, not because a court cleared him, but because the judge found no US jurisdiction. I went through the whole arc, the sacrifice mechanism, the allegations, the dismissal that was not an acquittal, and a blockchain whose biggest customer was its own founder.