Bitcoin Was Trapped in a Box Waiting on One Number. The Number Came In Hot
A ceiling near 87K, a floor near 80K, and $800 million of liquidations in between. Then the September CPI ran hot, yields jumped, and Bitcoin slid under 82K. Here is how the range was built and how it broke. None of this is financial advice. Prices and levels in this piece are as of October 14, 2026. Bitcoin and bond yields move daily.
Last verified Also on Medium
On this page
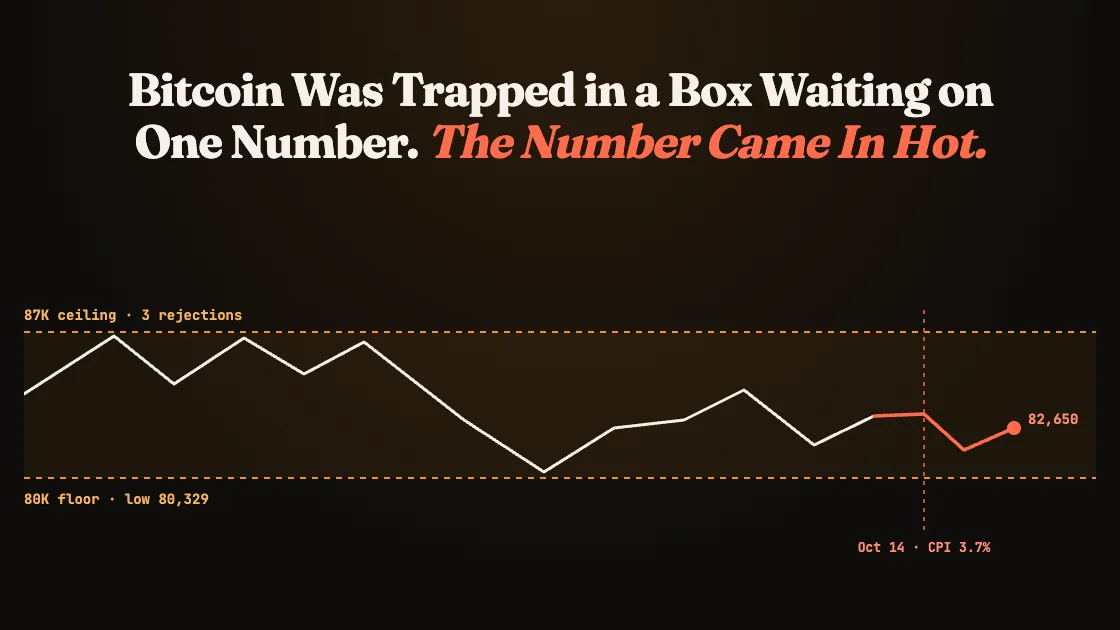
For most of October, Bitcoin got stuck in a box. A ceiling it could not break near 87K, a floor it kept defending near 80K, and a lot of traders getting chewed up trying to guess which way it would snap. The whole range was waiting on one number, the September inflation print, and on October 14 that number landed. It came in hot, and Bitcoin fell.
I want to walk through how the range was built, why a single inflation report held this much power over it, and how it actually resolved, because the resolution is already here and it was not the gentle one the bulls wanted.
How the box got built
The ceiling came first. Early in October, Bitcoin kept running into the 87K area and bouncing off. It pushed into that zone on the 2nd, tried again on the 4th, and had one more go on the 5th. 3 attempts, 3 rejections, with sellers waiting in the same spot every time. By the end of that stretch the message was simple, the sellers owned that ceiling.
Then came the break. On October 7, Bitcoin slipped under 83K, and the structure of the market changed. Up to that point every dip was just a dip inside a range that was holding. Once 83K went, it flipped from a level price sat above to a level price had to win back. Old support became new resistance, which is the kind of change that tells you the character of the move shifted.
The floor held next. The selling carried into the 8th and Bitcoin tagged just above 80K, printing a low around 80,329. Buyers stepped in hard right there, and by the next day it was bouncing, holding above 82K through the weekend. If sellers owned the ceiling, buyers clearly owned the floor.
Then the chop nobody enjoys. Bitcoin climbed back above 84K on the Sunday, rolled over on the Monday, and dropped back under 82K. That flush ran from Monday evening into Tuesday and took close to $800 million of liquidations with it, the overwhelming majority of them long positions. Put the 4 pieces together and the week reads cleanly, sellers on top, buyers on the bottom, and leverage ground up in between.
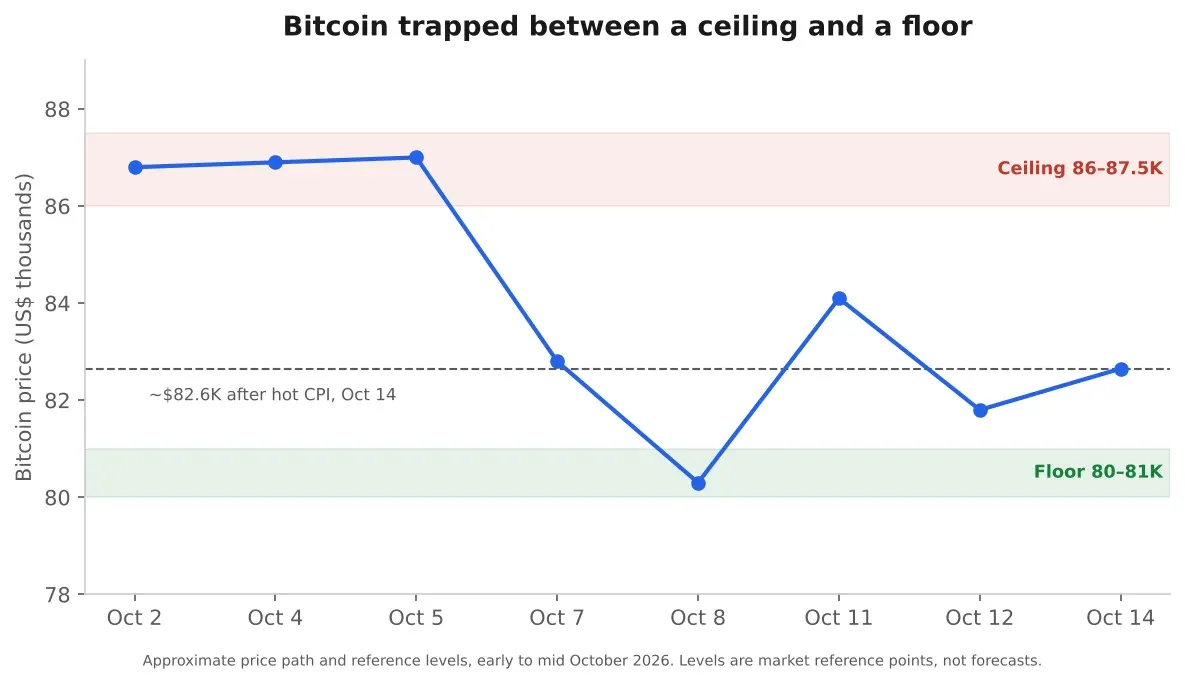
Figure 1. The box Bitcoin traded in through early October, a ceiling near 87K and a floor near 80K. Source: Price action, early to mid October 2026 (reference levels, not forecasts)
Altcoins took the worse beating
When longs get flushed across the board, altcoins get hit harder than Bitcoin, because they carry less liquidity and traders tend to pile far more leverage onto them. The weekend before the flush, money rotated hard into alts, some printing double digit gains, and then gave most of it back in a day once Bitcoin rolled over. Most of the majors fell roughly twice as hard as Bitcoin on the Monday, and some a lot worse.
You can see it in the market structure. Bitcoin’s share of the total crypto market cap pushed back toward 60%, a one month high. The money that stayed in crypto hid in Bitcoin, and the money chasing altcoins got punished. That rotation into Bitcoin during stress is one of the more reliable tells in this market, and it was flashing all week.
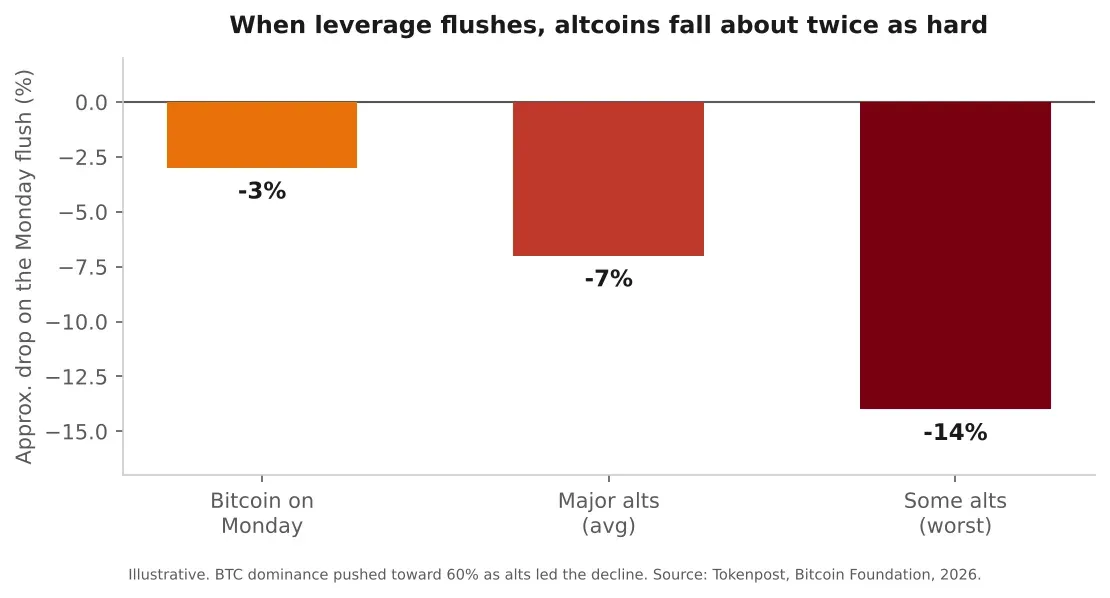
Figure 2. When leverage flushes, altcoins fall roughly twice as hard, and Bitcoin dominance climbs. Source: Tokenpost and Bitcoin Foundation, 2026
Why one inflation number carried the whole range
The September CPI mattered this much because of timing and backdrop. It was the last major inflation read the Federal Reserve gets before its rate decision on October 28, so it became the freshest number in front of the committee going into that meeting. The backdrop is bond yields, and they have been brutal. The 10 year Treasury yield sat around 5.2% going in, after touching 5.31% earlier in the month, close to its highest in about 20 years.
That yield is the thing the whole market keeps glancing at. When a government bond pays more than 5% with almost no risk attached, money has far less reason to hold something as volatile as Bitcoin. High yields also push up borrowing costs across the economy, which tightens financial conditions and leaves less speculative capital floating around. Higher rates drain liquidity, and Bitcoin trades on liquidity. So the link to the CPI was direct. A hot print would keep pressure on rates and keep liquidity tight. A cool print would ease it.
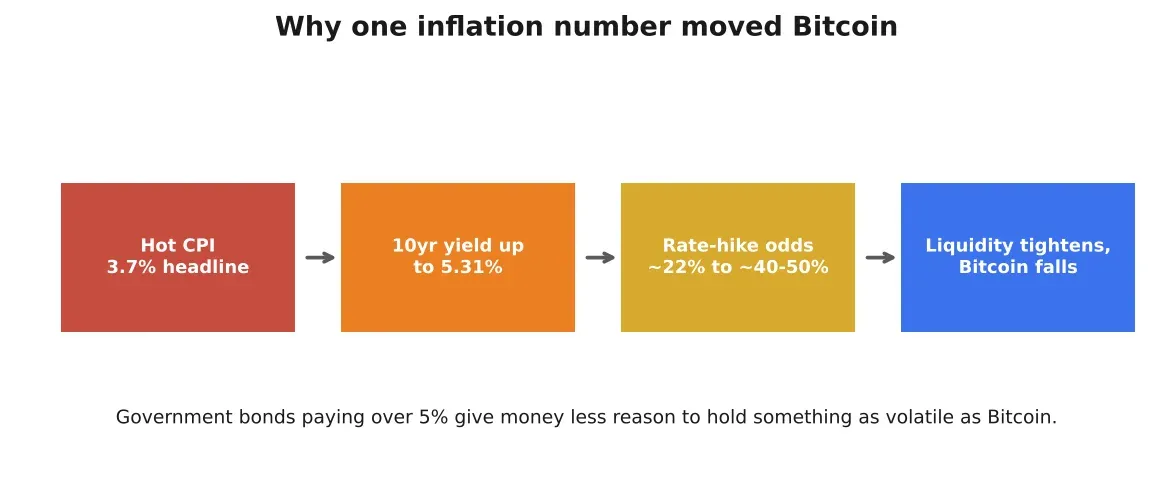
Figure 3. The chain from one inflation number to a lower Bitcoin price. Source: FinanceFeeds, Cointelegraph, 2026
How it actually resolved
The print was hot. Headline CPI rose to 3.7% year on year, up from 3.4% in August and at or just above forecasts that had clustered around 3.6%. The clearer miss was in core inflation, which came in at 2.6% against 2.5% expected, with the monthly core up 0.3% against a 0.2% forecast. The core beat is what matters most to the Fed, and it landed on the wrong side for anyone hoping for rate relief.
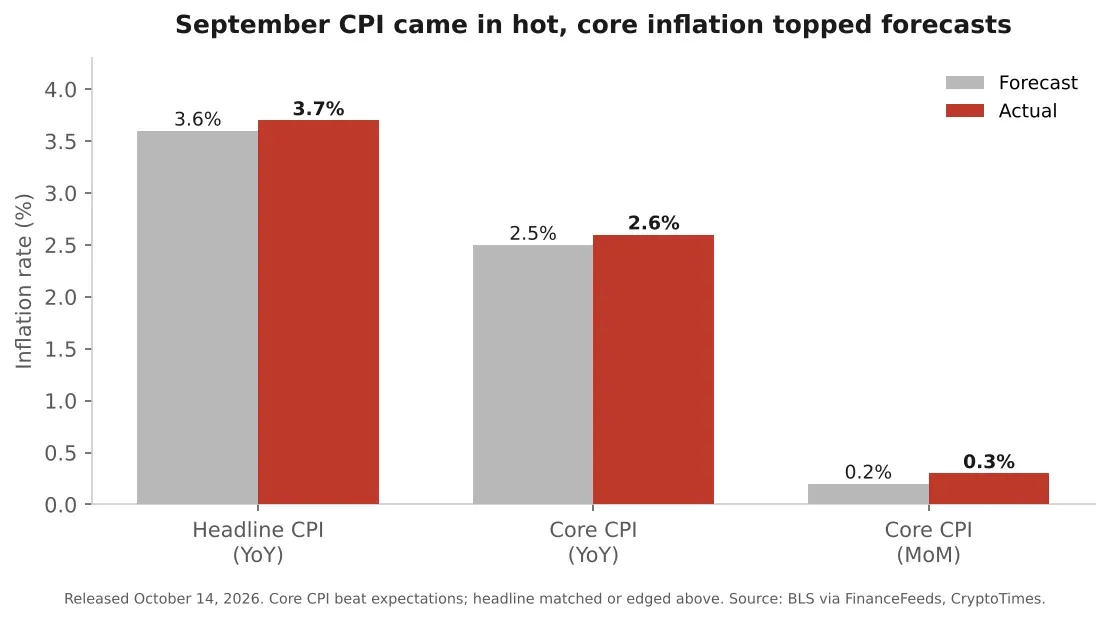
Figure 4. September core CPI topped forecasts; the headline matched or edged above, reviving rate hike bets. Source: BLS via FinanceFeeds and CryptoTimes, Oct 14 2026
Markets reacted the way the setup predicted. The 10 year Treasury yield jumped about 9 basis points to 5.308%, and the 2 year rose even more. Futures that had priced roughly a 22% chance of an October rate hike before the data repriced toward 40%, with some measures pushing closer to 50%. Bitcoin slid under 82K and sat around 82,650 on the day, with the broader crypto market selling off alongside it. The floor the bulls had been defending near 80K suddenly looked a lot closer.
The levels that still matter
The reference levels from the week are still the map, so here they are, framed as what they are, market reference points rather than predictions. The ceiling sits between 86K and 87.5K, the zone that rejected every rally in October. Above it, the character of the market changes. Below it, any bounce is still just a bounce inside the range. The floor sits between 80K and 81K, defended on the 8th and again on Monday, which bottomed around 81.6K. Hold it and the range stays intact. Lose it on a daily close and the whole structure of the month is gone, with 78K cited as the bear case below.
There is also the total crypto market cap, which the chart watchers put around a 2.7 trillion line, with 2.6 trillion sitting just below. If 2.7 trillion breaks, altcoins tend to take the worst of it again, the same pattern as the Monday flush.
What I would actually take from this
Strip away the exact numbers and the week taught one durable lesson. Bitcoin is trading as a liquidity asset right now. It moved on a Treasury yield and a CPI print, the same things moving stocks and bonds. That is how a risk asset behaves, rather than the inflation hedge or digital gold it is sometimes sold as, and it tells you where its correlation sits at the moment. When real yields are above 5%, the competition for money is stiff, and a volatile asset has to fight for every dollar.
The near term probably stays headline driven into the October 28 Fed decision, and the hot CPI tilts the odds toward more pressure rather than less. The levels give you a way to read the tape, not a guarantee of where it goes. None of this is a trade recommendation, and I am not telling you to buy or sell anything. Watch the yield, watch the floor near 80K, and treat anyone selling you certainty about the next move with the skepticism it deserves.
Sources
- CryptoTimes, US CPI live: inflation rises to 3.7% in Septembercryptotimes.io. Accessed 15 October 2026.
- FinanceFeeds, Bitcoin price $82,650 after hot CPI, October hike oddsfinancefeeds.com. Accessed 15 October 2026.
- Cointelegraph, Bitcoin gives up $82K as hot CPI sends bonds toward new highscointelegraph.com. Accessed 15 October 2026.
- Bitcoin Foundation, Bitcoin dominance hits 60% as selloff hammers altcoinsbitcoinfoundation.org. Accessed 15 October 2026.
- Yahoo Finance, Bitcoin and Ethereum prices sliding after higher-inflation reportfinance.yahoo.com. Accessed 15 October 2026.
Related stories

Crypto & markets
Crypto Was Built to Cut Out the Banks. The Banks Just Cut Back In.
There is a version of this story where the banks came around. Where the suits finally did their research, got over their scepticism, and concluded that blockchain technology was worth taking seriously. That is the version the press releases describe.

Crypto & markets
Wall Street Filed an Automatic Bitcoin Buyer. It Runs on Stock Dividends.
On June 18, 2026, Franklin Templeton, a $1.5 trillion asset manager founded in 1947, filed registration statements with the SEC for 2 exchange-traded funds built around one of the oldest and most boring ideas in finance. A dividend reinvestment plan. The twist is where the dividends go.
Crypto & markets
Bitcoin Is Down 53% From Its Peak With Every Macro Reason to Rally.
Bitcoin dipped to an intraday low of $59,100 on June 5, 2026, its lowest level since September 2024, marking a 53% collapse from the $126,272 all-time high it set in October 2025. The Block confirmed Bitcoin trading near $60,750 on June 28, down more than half from its October peak.