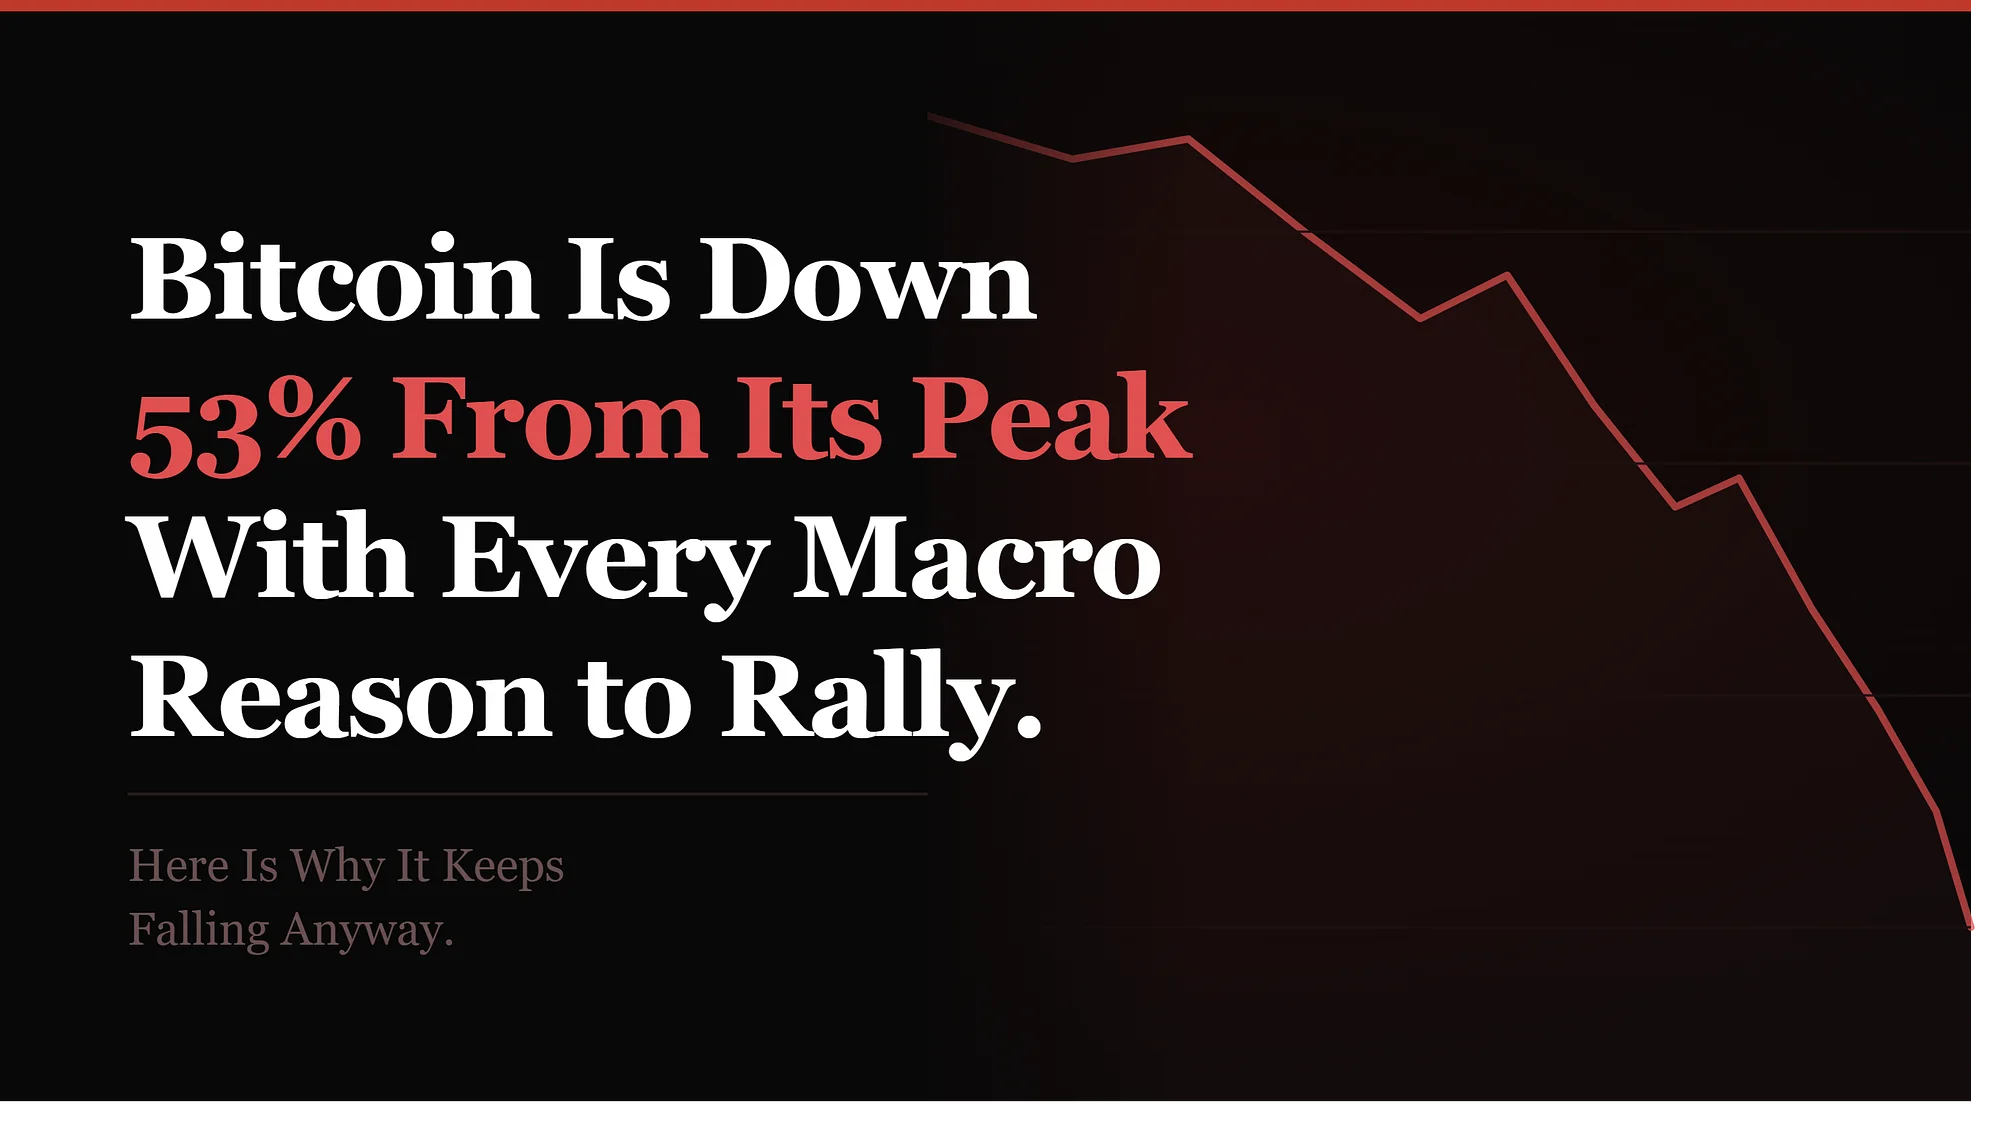
Bitcoin Is Down 53% From Its Peak With Every Macro Reason to Rally.
Bitcoin dipped to an intraday low of $59,100 on June 5, 2026, its lowest level since September 2024, marking a 53% collapse from the $126,272 all-time high it set in October 2025. The Block confirmed Bitcoin trading near $60,750 on June 28, down more than half from its October peak.
Last verified Also on Medium
On this page
- The Fed Changed the Math and Everything Followed
- 4 Simultaneous Selling Pressures That Made It Relentless
- The ETF Reversal
- Strategy’s Buying Machine Seized Up
- Miners Forced into the Market
- Long-Term Holders Capitulating
- Where Is the Bottom? What the Data Actually Says
- The 3 Signals That Will Tell You the Worst Is Over
- The Honest Context for What Is Actually Happening
Bitcoin dipped to an intraday low of $59,100 on June 5, 2026, its lowest level since September 2024, marking a 53% collapse from the $126,272 all-time high it set in October 2025. The Block confirmed Bitcoin trading near $60,750 on June 28, down more than half from its October peak. The average investor in BlackRock’s IBIT Bitcoin ETF is now sitting on a loss of roughly 40%.
Here is what makes this drawdown genuinely confusing to watch. The macro backdrop reads like a Bitcoin bull case checklist. The dollar is under pressure. CPI inflation came in at 4.2% in May, its highest reading since April 2023 and more than double the Fed’s 2% target. Geopolitical tensions are elevated. Every one of those conditions has historically been cited as a reason to own Bitcoin as a hedge against monetary debasement.
Despite all of that, Bitcoin has bled for seven consecutive weeks. So the question worth sitting with is not whether the price is falling. It is why it keeps falling when the conditions for it to rise appear to be clearly in place.
The answer comes down to one decision Wall Street made that changed the opportunity cost calculation for every institutional capital manager in the market, and a cascading set of forced sellers that piled on top of it.
The Fed Changed the Math and Everything Followed
On June 17, 2026, new Federal Reserve Chair Kevin Warsh held his first FOMC meeting. The Block reported that traders have since priced in better-than-even odds of a rate increase in December. Rates were held at 3.5 to 3.75% by a unanimous 12 to 0 vote, but nine out of 18 FOMC participants now project at least one rate hike before the end of 2026, according to the dot plot released after the meeting.
Before the June meeting, the probability of a December rate hike was around 24%. Following the meeting and the May PCE inflation print, that probability has moved to roughly 77%. The dot plot shifted decisively in a hawkish direction.
24/7 Wall Street’s analysis described this as a hawkish hold, and its effect on Bitcoin is mechanical. US Treasuries are currently yielding 4.5 to 5% nominal, translating to approximately 2.2% real yield after inflation. That is the highest real yield since Bitcoin existed as an asset class. Bitcoin pays you nothing. For an institutional capital manager running a risk model, the calculation is straightforward: why hold a non-yielding asset in a drawdown when government bonds pay a real return to do nothing?
The debasement trade, the idea that a debased dollar and rising inflation make Bitcoin the obvious hedge, has unwound precisely because the alternative to Bitcoin now pays. That is the root cause of everything that follows.
4 Simultaneous Selling Pressures That Made It Relentless
The ETF Reversal
The Bitcoin ETFs that launched in January 2024 were supposed to represent permanent institutional demand. For much of 2024 and early 2025, they functioned that way. In 2026, they have become the dominant selling mechanism. Crypto Briefing reported that US-listed spot Bitcoin ETFs have recorded approximately $4.06 billion in net outflows in June 2026, making it the worst month for ETF withdrawals since these products launched, eclipsing the previous record of $3.56 billion set in February 2025.
For the week ending June 26 alone, KuCoin confirmed that US spot Bitcoin ETFs lost roughly $1.79 billion, with BlackRock’s iShares Bitcoin Trust (IBIT) accounting for approximately $1.30 billion of that total, or nearly 73% of the weekly exit. On June 26 alone, Bitcoin.comNews reported IBIT saw $444.5 million in single-day redemptions, its largest single-day exit since launching in January 2024. The June 26 outflow capped seven consecutive days of net outflows and seven straight weeks of negative flows, the longest weekly outflow streak on record for the category.
When investors redeem IBIT shares, BlackRock must sell actual spot Bitcoin to settle those redemptions. The supposedly permanent institutional bid that helped propel Bitcoin to $126,000 has flipped into structural forced selling. TFTC’s analysis noted that the two consecutive record outflow streaks in May and June 2026 combined to drain an estimated $7.2 billion from the ETF complex, pushing year-to-date cumulative flows into negative territory for the first time, a milestone confirmed by Bloomberg ETF analyst Eric Balchunas.
Strategy’s Buying Machine Seized Up
Strategy holds 847,363 Bitcoin at an average cost basis of approximately $75,640 per coin. 24/7 Wall St. confirmed this figure, noting that with Bitcoin near $60,000 the position is underwater by approximately $13 billion. The company’s preferred stock STRC, designed to trade near $100, is currently sitting around $71, roughly 25 to 29% below par.
When STRC trades below par, issuing new shares destroys value rather than creating it. The flywheel mechanism that made Strategy the most aggressive Bitcoin buyer in the market has seized up. Accumulation collapsed from roughly 50,000 Bitcoin in April to just 3,600 in June. In late May, Strategy sold 32 Bitcoin to cover dividend payments, its first sale since 2022, ending the never-sell doctrine that had been central to the company’s identity since Michael Saylor established it.
That sale was trivially small against a stack of 847,000 coins. Its significance was entirely symbolic: the company that turned never selling into a founding principle crossed that line because the fixed dividend obligations do not pause when Bitcoin falls.
Miners Forced into the Market
CryptoSlate’s analysis from June 27 placed the all-in estimated production cost to mine one Bitcoin near $84,300, with Bitcoin trading around $60,000. CoinShares put the weighted average cash cost among public miners at roughly $79,995 in Q4 2025, estimating that between 15 and 20% of the global mining fleet is now operating underwater on a full-cost basis.
In mid-June, network difficulty fell 10.09%, dropping from 138.96 trillion to 124.93 trillion. Galaxy Research described this as the second-largest downward difficulty adjustment of 2026 and the eleventh-largest in Bitcoin’s entire history. The adjustment reflects how many higher-cost machines went dark once their operating margins disappeared. Public miners shed more Bitcoin in Q1 2026 alone than they did across all of 2025, a pace of treasury liquidation that surpassed even the selling seen during the Terra Luna collapse. The Hash Ribbon signal, which tracks when miners are forced to sell, has triggered.
Long-Term Holders Capitulating
The signal that matters most to on-chain analysts is the long-term holder spent output profit ratio, currently sitting at approximately 0.88. When this metric falls below 1.0, it means the cohort of investors who held Bitcoin for 155 days or more, the people with the strongest conviction in the network, are now selling at a loss for the first time this cycle. Glassnode data shows that in one 48-hour window in early June, $2.4 billion in long-term holder losses were realised.
These are not new entrants panic-selling. These are the people who held through every prior crisis. When they sell at a loss, it reflects a different level of conviction erosion than retail capitulation.
Where Is the Bottom? What the Data Actually Says
There is no consensus on this, and anyone claiming precision is selling something. What does exist is a range of data points that define the zone where previous cycles found their floors, and a set of signals that have not yet confirmed whether we are in that zone.
The realised price, the weighted average of what every current holder paid for their Bitcoin, sits at approximately $53,400. Mudrex’s June 2026 analysis treats this as the most significant structural support level for the cycle, with the $50,000 to $55,000 range described as the value zone where long-term holders should be accumulating aggressively. The 200-week moving average sits near $62,200 and Bitcoin has just broken below it for the first time in this cycle.
The MVRV ratio is currently around 1.1, approaching the cheap zone but not yet confirming a definitive bottom. In 2015, 2018, and 2022, the MVRV broke below 1.0 before a durable recovery began. At 1.1, it has not crossed that threshold. 10x Research calls $54,000 to $57,000 as a target range. The options market is pricing support near $52,000. More bearish historical fractals point toward $30,000 to $38,000. Galaxy Digital’s Alex Thorn has flagged $40,000 to $46,000 as a structural floor zone if corporate treasury forced selling materialises at scale.
On timing, a striking number of independent analysts converge on Q4 2026 as the highest probability bottom window. Mudrex noted that the historical pattern of a 12 to 15-month post-peak drawdown, combined with the post-halving cycle, points toward October to December 2026 as the most probable bottom period. That aligns with a potential $50,000 to $55,000 floor, though the range toward $40,000 remains live if forced selling accelerates.
The 3 Signals That Will Tell You the Worst Is Over
Timing an exact bottom is functionally impossible. Recognising when the conditions for a recovery are assembling is more tractable. Three specific signals matter.
The first is the MVRV ratio breaking below 1.0. Track this on Glassnode. When the average holder is underwater, the market has historically crossed into the definitive capitulation zone. At 1.1, that threshold has not yet been crossed. Every prior generational bottom in 2015, 2018, and 2022 saw this metric go negative before recovery. If it does not, this cycle may be structurally different enough that the floor forms earlier. If it does, the entry zone opens with high historical precedent.
The second is ETF flows turning consistently positive. Track this daily on SoSoValue. A single day of inflows means little. A week of sustained positive flows across multiple funds, rather than one IBIT-concentrated recovery day, signals a genuine shift in institutional positioning rather than a technical bounce. The June 23 inflow of $39.2 million was encouraging. It has not yet been confirmed as the start of a trend.
The third is any signal from the Federal Reserve toward accommodation. Track Fed rate expectations on CME FedWatch. Currently, roughly 77% probability is priced into a rate hike by December. If that probability falls significantly, or if Fed language shifts toward cuts, the opportunity cost that is currently suppressing Bitcoin demand partially reverses. Bitcoin has historically done best when liquidity is loose. A Fed pivot is not required for a bottom, but it materially changes the upside case for the recovery.
The Honest Context for What Is Actually Happening
This 53% drawdown is the shallowest bear market in Bitcoin’s history. The 2018 cycle fell 84% from peak to trough. The 2022 cycle fell 77%. Bitcoin’s full price history on Bitbo shows that every prior cycle of comparable severity recovered to new all-time highs. That pattern does not guarantee anything about this cycle, but it is relevant context for interpreting the current sentiment environment.
The Bitcoin is dead narrative circulating on social media right now is almost word-for-word identical to the narrative at the FTX bottom in November 2022, when Bitcoin was at $15,500. The people who treated that sentiment as a buy signal and accumulated through the ugliness captured the entire move to $126,000. Whether the same pattern applies here depends on whether the structural conditions that caused this decline, specifically the hawkish Fed and the AI trade absorbing speculative capital, reverse in a timeframe that aligns with the historical cycle bottom window.
What has not changed is the underlying thesis. Bitcoin’s supply schedule is fixed. The network continues producing blocks. Institutional custody infrastructure is deeper than any prior cycle. Long-term holders, despite the painful realised losses in early June, have not shown signs of wholesale exit. Whales have been reported accumulating below $60,000 even as the ETF complex continues to sell.
What changed is the price of the alternative. When bonds pay a real return, Bitcoin competes on a different basis than when cash pays nothing. The debasement trade returns when the Fed blinks. The question is whether that happens before the forced sellers in the ETF complex and the mining sector complete their exit.
Nobody can tell you where the exact bottom is. The data available suggests it is closer than the peak was. The signals that would confirm it have not fully fired. The macro catalyst that would accelerate the recovery, a shift in Fed language toward accommodation, has not arrived. Both the accumulation case and the one-more-leg-lower case are using the same three signals. The outcome depends on which one fires first.
Sources
- Bitcoin.com News: Why Is Bitcoin Crashing? Worst Week of 2026, $59,100 Low, June 5, 2026 — Confirmed intraday low of $59,100 on June 5. Coinglass $1.75 billion in 24-hour liquidations. Bitcoin fell below 200-week moving average for first time since June 2022.bitcoin.com. Accessed 29 June 2026.
- The Block: Average IBIT Investor Down 40%, Seven Straight Weeks of ETF Outflows, June 26, 2026 — Bitcoin at $60,750 on June 28. Seven consecutive weekly outflow record confirmed. Bespoke Investment Group data on average IBIT investor loss.theblock.co. Accessed 29 June 2026.
- Crypto Briefing: Bitcoin ETF Worst Monthly Outflows Since Launch, June 2026 — $4.06 billion in June outflows, record since launch. Weekly pace: $1.72 billion for week ending June 6. Six-week cumulative total: $5.94 billion.cryptobriefing.com. Accessed 29 June 2026.
- KuCoin: BlackRock IBIT Accounts for 73% of Bitcoin ETF Outflows in June 2026 — Week of June 22 to 26: $1.79 billion total outflows. IBIT $1.30 billion. IBIT assets at $44.87 billion as of June 26.kucoin.com. Accessed 29 June 2026.
- Bitcoin.com News: Bitcoin and Ethereum ETFs Bleed for Seventh Day as IBIT Sheds $445 Million, June 26, 2026 — $444.5 million June 26 outflow. Largest single-day IBIT withdrawal since January 2024 launch.bitcoin.com. Accessed 29 June 2026.
- TFTC: Bitcoin ETFs Shed $7.2 Billion Across Two Record Outflow Streaks in 2026 — Combined May and June streak data. YTD flows turned negative for first time. Bloomberg ETF analyst Eric Balchunas confirmation.tftc.io. Accessed 29 June 2026.
- NPR: Federal Reserve Holds Rates Steady and Hints at Rate Hike, June 17, 2026 — CPI inflation at 4.2% in May, highest since April 2023. Warsh’s first FOMC meeting. Rate held at 3.5 to 3.75%.npr.org. Accessed 29 June 2026.
- CNBC: Fed Interest Rate Decision June 2026 –9 of 18 dot plot participants project at least one rate hike in 2026. Unanimous 12 to 0 vote to hold. Forward guidance removed from statement.cnbc.com. Accessed 29 June 2026.
- 24/7 Wall Street: When Will Bitcoin Recover to Its $126,000 All-Time High — Strategy average cost basis $75,527. Real Treasury yield context. Hawkish hold analysis.247wallst.com. Accessed 29 June 2026.
- CryptoSlate: Bitcoin’s Broken Production Cost Floor Is Splitting Miners Into Survivors and Sellers, June 27, 2026 — All-in production cost near $84,300. 15 to 20% of fleet underwater. 10.09% difficulty drop. Q1 2026 miner treasury sales exceed all of 2025.cryptoslate.com. Accessed 29 June 2026.
- CoinDesk: As Bitcoin Miners Cut Unprofitable Production, Hash Ribbon Points to Price Rebound, January 2026 — Hash Ribbon capitulation signal mechanics. Historical context from FTX collapse and yen carry trade unwind.coindesk.com. Accessed 29 June 2026.
- Mudrex: When Will Bitcoin Bottom? Prediction Updated June 2026 — Realised price at $53,400. Q4 2026 bottom window convergence across analysts. $50,000 to $55,000 value zone. $40,000 to $60,000 historically attractive range.mudrex.com. Accessed 29 June 2026.
- BeInCrypto: Strategy Collapse as Crypto Black Swan Risk Analysis 2026 — Galaxy Digital’s Alex Thorn on $40,000 to $46,000 structural floor. Corporate treasury forced selling scenario.beincrypto.com. Accessed 29 June 2026.
- Glassnode: Bitcoin Market Metrics — MVRV ratio, long-term holder SOPR, supply in loss data. Live on-chain tracking.glassnode.com. Accessed 29 June 2026.
- SoSoValue: US Spot Bitcoin ETF Daily Flow Tracker — Live daily ETF flow data for all 12 US spot Bitcoin ETFs.sosovalue.com. Accessed 29 June 2026.
- CME FedWatch Tool — Live Federal Reserve rate probability tracking. 77% December 2026 hike probability as of late June.cmegroup.com. Accessed 29 June 2026.
- Bitcoin Price History Chart, Bitbo — Full historical Bitcoin price data. 2018 drawdown 84%, 2022 drawdown 77%, current cycle 53%.charts.bitbo.io. Accessed 29 June 2026.
Related stories

Crypto & markets
Wall Street Filed an Automatic Bitcoin Buyer. It Runs on Stock Dividends.
On June 18, 2026, Franklin Templeton, a $1.5 trillion asset manager founded in 1947, filed registration statements with the SEC for 2 exchange-traded funds built around one of the oldest and most boring ideas in finance. A dividend reinvestment plan. The twist is where the dividends go.

Crypto & markets
Richard Heart Beat the SEC on a Technicality, Then His Own Tax Office Caught Up With Him in…
On 14 October 2026, Turkish police arrested the founder of Hex and PulseChain on an Interpol red notice issued for Finland, which suspects him of gross tax evasion. He had walked away from a $1 billion SEC case 18 months earlier, not because a court cleared him, but because the judge found no US jurisdiction. I went through the whole arc, the sacrifice mechanism, the allegations, the dismissal that was not an acquittal, and a blockchain whose biggest customer was its own founder.
Crypto & markets
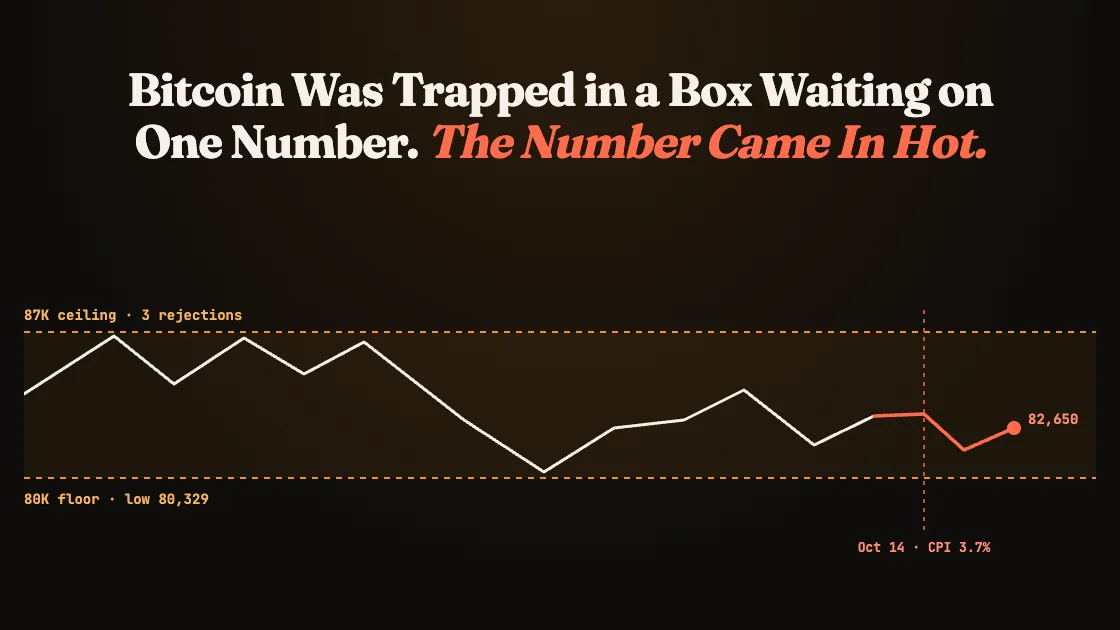
Bitcoin Was Trapped in a Box Waiting on One Number. The Number Came In Hot
A ceiling near 87K, a floor near 80K, and $800 million of liquidations in between. Then the September CPI ran hot, yields jumped, and Bitcoin slid under 82K. Here is how the range was built and how it broke. None of this is financial advice. Prices and levels in this piece are as of October 14, 2026. Bitcoin and bond yields move daily.